
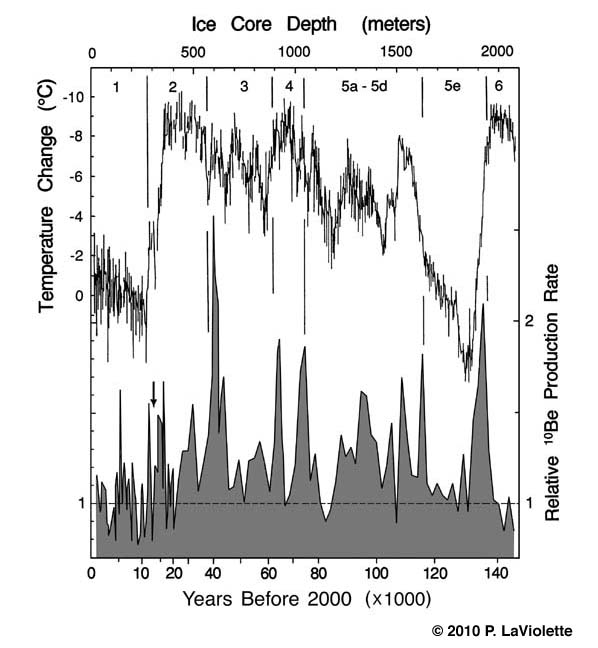
Figure 5. Graph showing that cosmic ray intensity has varied considerably during the past hundred twenty thousand years. Lower profile: Cosmic ray intensity at the Earth's surface calculated from variations in the concentration of beryllium-10 in the ice record adjusted for changes in ice accumulation rate. Upper profile: Global temperature. Climatic zones include: the present interglacial (1), last ice age (stages 2, 3, & 4), previous semi-glaciated period (stage 5a-d), last interglacial (stage 5e), and previous glaciation (stage 6). [An explanation of how this cosmic ray intensity profile was calculated from published beryllium-10 data is presented in the update to Dr. LaViolette's dissertation and in the appendix of a paper preprint available for download.]