
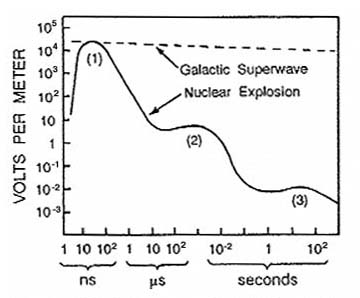
Figure 7. Intensity vs. time plot for EMP from a high-altitude nuclear explosion (solid line) compared to that from a hypothetical superwave (dashed line). The numbers designate early-time, intermediate-time, and late-time EMP phases (ns = nanoseconds, µs = microseconds).